Forstok Analytics
Unify your data with Forstok Cloud Analytics
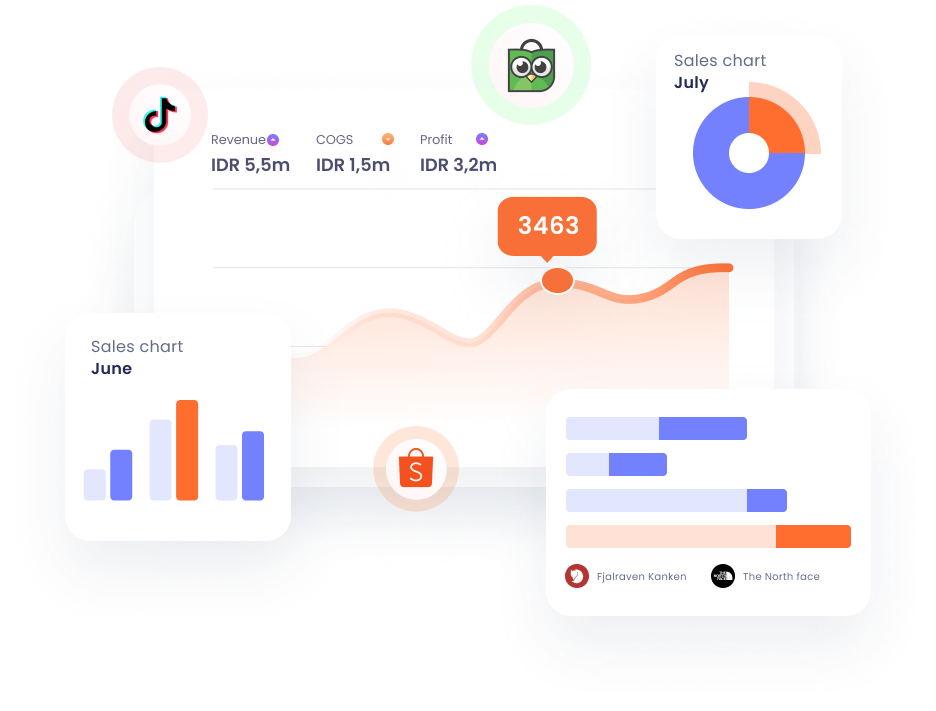
Enable businesses to quickly and easily connect, analyze, and visualize their data to make data-driven decisions in minutes.
or Login→
Why Forstok Analytics?
Out-of-the box Integrations
Quickly turn data into actionable insights and make informed decisions right away
Unified data across sales channels
Consolidating and combining data from different sources to avoid data silos.
Rich data visualisations
Present complex data sets in a simplified and easy-to-understand format
Govern your data securely
Protecting sensitive information from unauthorized access, ensuring data privacy is secured.
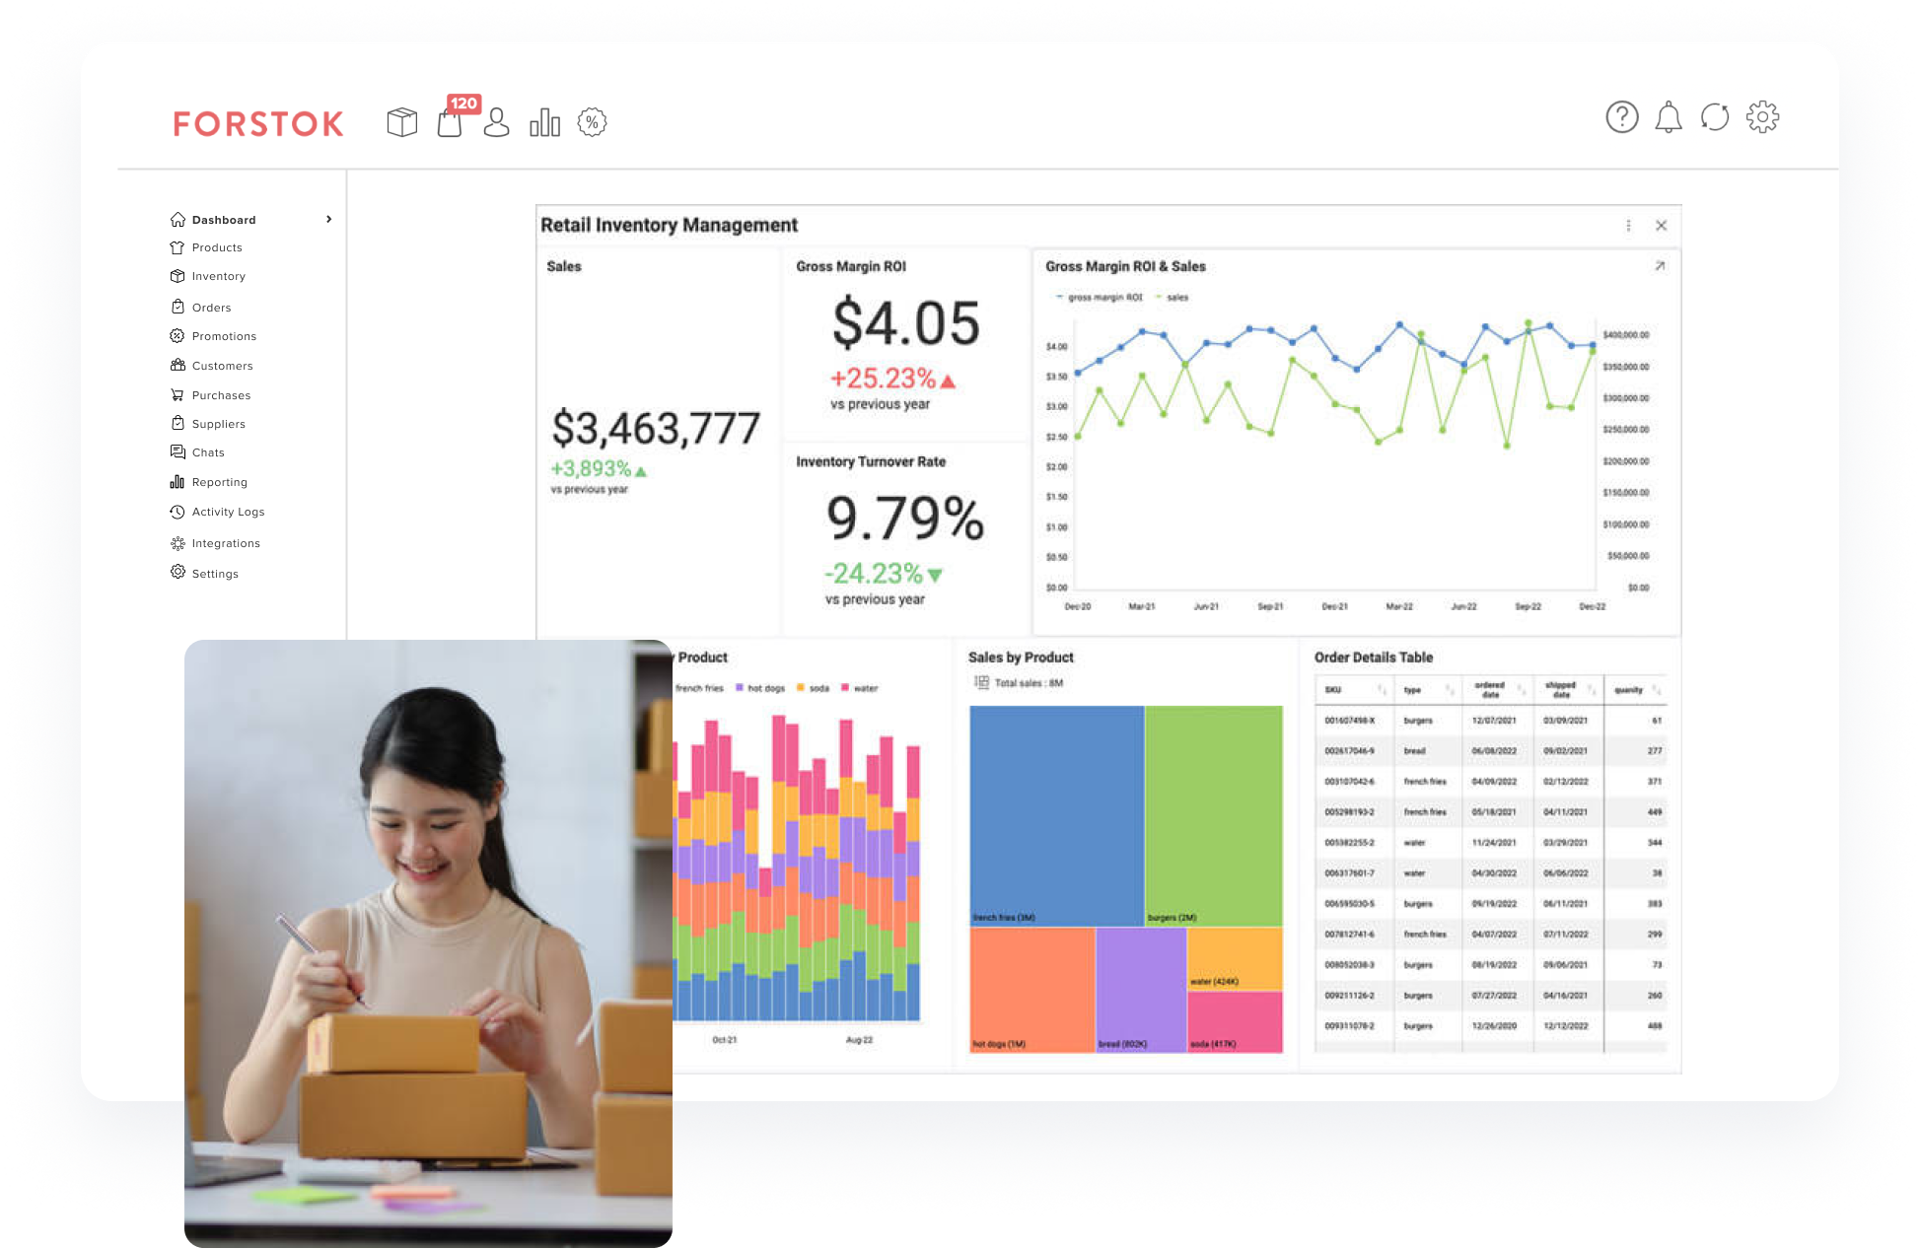
Sales Reports
Track sales across channels in real-time
Overview of the revenue, units sold, and other metrics that are important to understand the business's sales performance.
Sample reporting:
- Total sales: This is the total amount of revenue generated by the business.
- Sales by product category: Identifying which categories are doing well and need attention.
- Sales by location: Showing which locations are generating the most sales.
- Sales by channel: Optimize sales by identifying the channels generating the most revenue.
- Gross margin: Analyze the financial health of a business, identify areas for improvement
Inventory Reports
Optimize your inventory with data-driven reporting
These reports track inventory levels, turnover rates, and other metrics related to stock management.
Sample reporting:
- Stock Report: Provides a detailed snapshot of inventory levels and stock on hand
- Valuation Report: Shows the total value of inventory and how it is valued (average cost).
- Turnover Report: Measures how quickly inventory is selling and how often it is being replenished.
- Dead Stock Report: Identifies products that have not sold in a certain period and may need to be discounted or removed from inventory.
- Aging Inventory Report: Displays how long inventory has been sitting in stock, allowing businesses to take action before products expire or become obsolete.
- Stock Movement Report: Tracks the movement of inventory in and out of the warehouse, including sales, returns, and transfers.
Operational Reports
Maximize your operational speed and efficiency
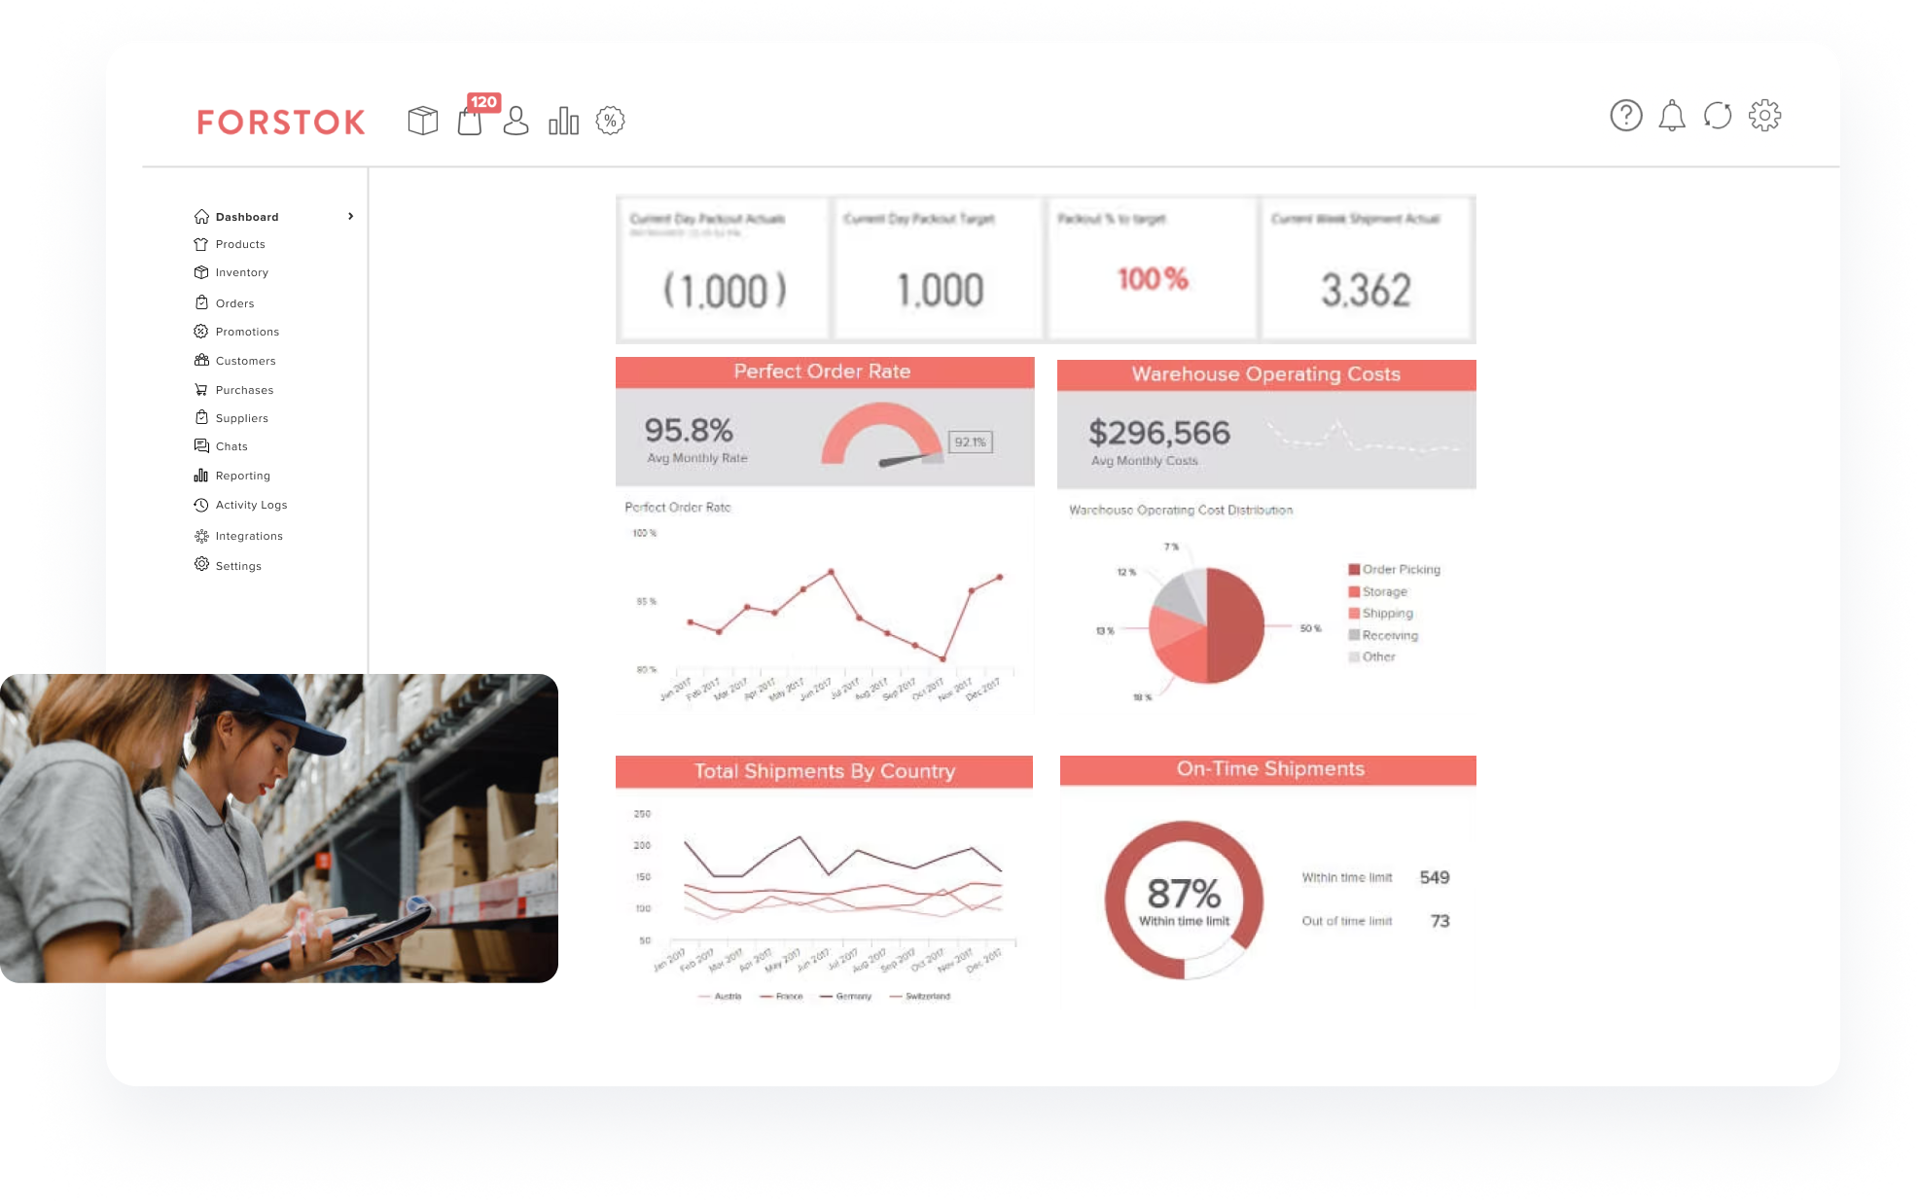
These reports track operational metrics, such as fulfillment speed, picking and packaging efficiency, to identify areas for improvement and optimize operations
Sample reporting:
- Lead Time Report: track and analyze the time it takes for products to move through the entire order fulfillment process.
- Pick pack efficiency report measures the speed and accuracy of the picking and packing processes in a warehouse.
- Resource Utilization Report: identify inefficiencies in resource allocation to improve overall efficiency and productivity
- Inbound and outbound Report: Monitor the efficiency and accuracy of the delivery process to improve overall performance.
Marketing Reports
Data-driven insights to fuel your marketing success
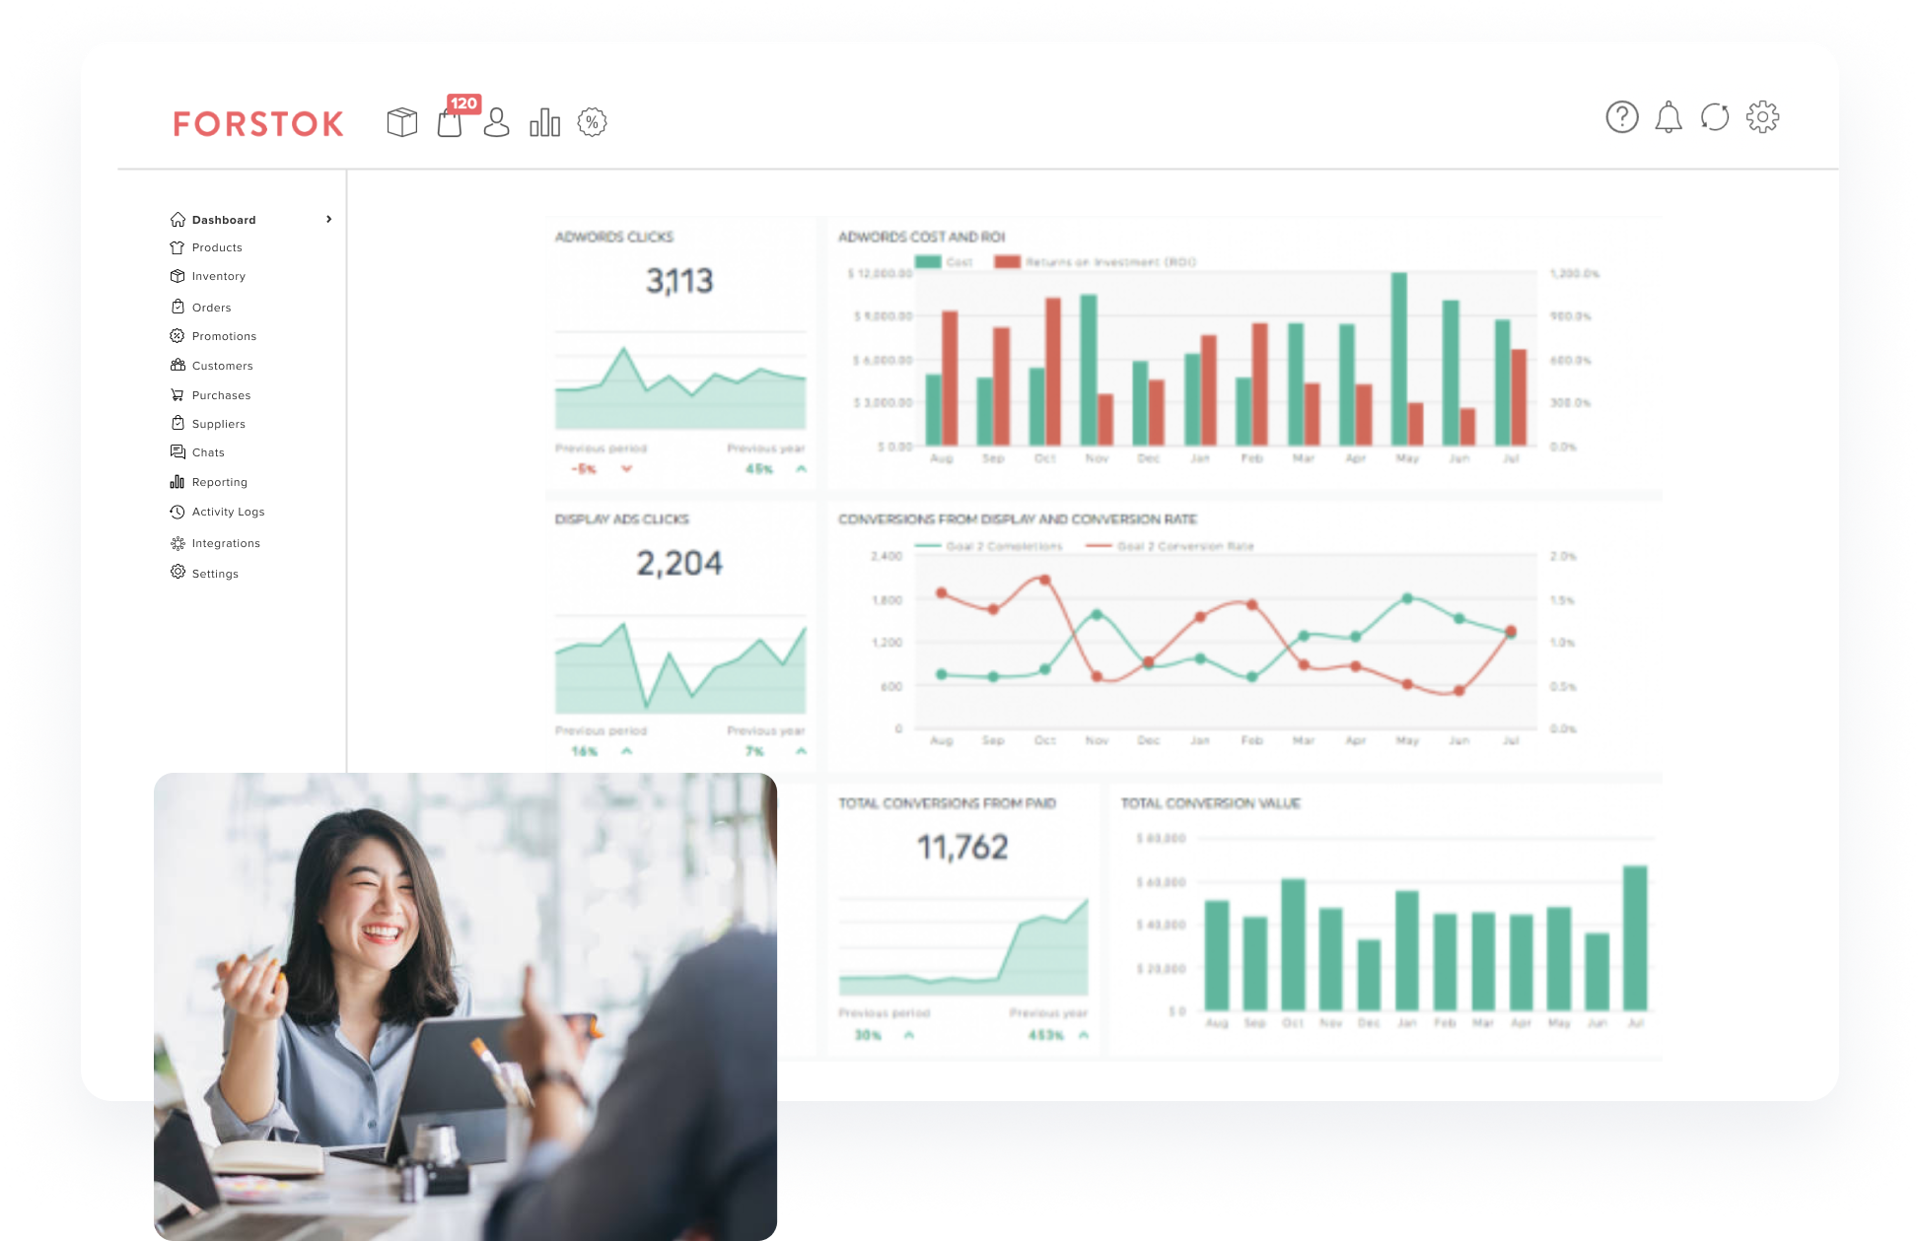
These reports can track and analyze the performance of your marketing campaigns and sales efforts on various online marketplaces.
Sample reporting:
- Marketing Channel Performance Report: To identify which channels are most effective in generating sales to optimize marketing strategies.
- Campaign Performance Report: evaluates the effectiveness of a specific marketing campaign to achieve better results and maximize ROI
- Seller Voucher Report: tracks the performance of voucher codes to understand the effectiveness of the campaigns.
Get started with Forstok today
Enable businesses to quickly and easily connect, analyze, and visualize data to make data-driven decisions in minutes.
PT. Forstok Teknologi Indonesia
18 Office Park LT 10 unit A Jl. TB Simatupang No. 18, Jakarta Selatan. DKI Jakarta. 12520.
Copyright © 2023 PT. Forstok Teknologi Indonesia. All rights reserved.


